
Dollar for dollar, the winning nations at the Olympic Games seem to be the poorest
- Written by Malcolm Whyte, Emeritus Professor of Clinical Science, Australian National University
Success in the Olympic Games is usually focused on medals, especially gold ones, and countries are usually ranked in terms of the number of medals won, and sometimes as medals per million of population or gross domestic product.
Examining individual countries this way yields some clues as to what is associated with success, but other striking insights emerge when the countries that won medals are divided into groups.
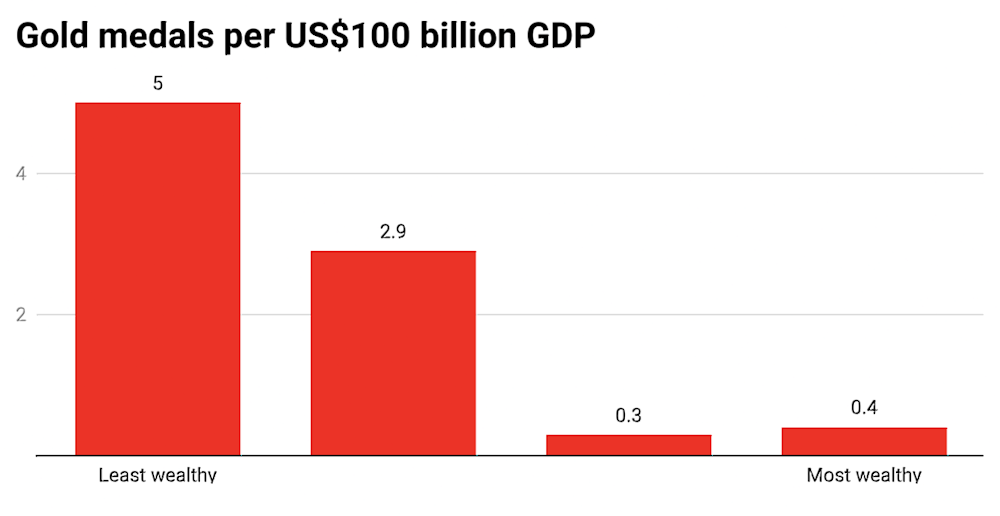
I’ve divided the 88 countries that won medals in the 2016 Rio Games into four large groups ranked by population (one group contains the 22 most populous nations, the next group 22 which are the next largest bloc, and so on) and also into four large groups ranked by total wealth.
Read more: For now, the Tokyo Olympics will go ahead. But at what cost?[1]
Looking at the results this way, as if there were four and not 88 medal-winning participants, reveals that the least populous bloc won far more medals per 100 million population, by a factor of about 12, both gold and total, than the most populous bloc.
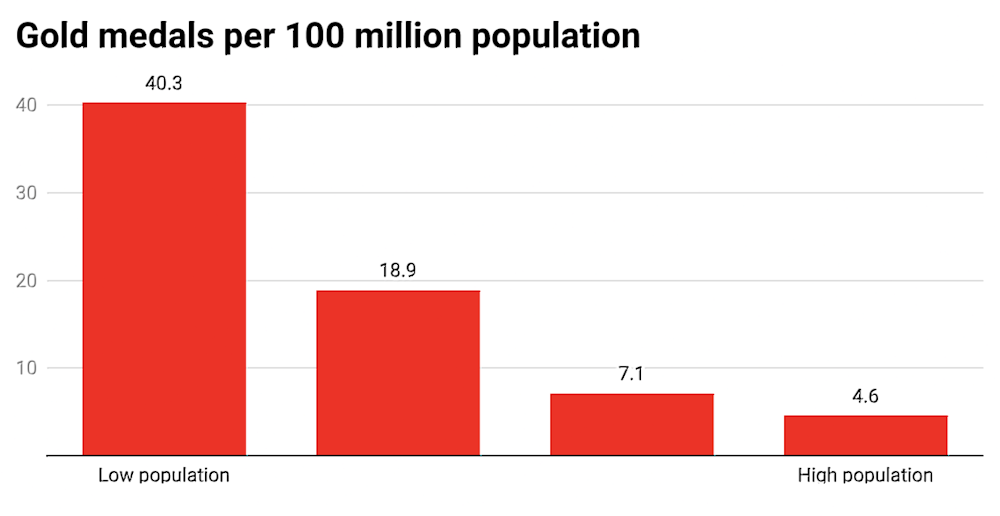
 On its face, this is surprising. The group of countries with the largest populations have the largest number of potential athletes to choose from and win the largest overall numbers of medals.
Just as strikingly, and just as surprisingly, the least-wealthy bloc of countries won far more medals per US$ trillion of wealth than the wealthiest bloc.
On its face, this is surprising. The group of countries with the largest populations have the largest number of potential athletes to choose from and win the largest overall numbers of medals.
Just as strikingly, and just as surprisingly, the least-wealthy bloc of countries won far more medals per US$ trillion of wealth than the wealthiest bloc.
 Similar patterns emerged in the results of the 2016 Paralympics, the 2018 Commonwealth Games at the Gold Coast and the 2012 London Olympics.
If these results are driven by wealth rather than population (the two move together) they might flow from the things that tend to be associated with wealth, among them less exercise, more labour-saving devices and a less-healthy diet.
People in smaller and less-affluent countries might be more physically active and perhaps in better shape to become elite athletes.
Whatever the reasons, it seems clear that on an aggregate basis (not an individual basis) the ability to spend more money winning medals doesn’t translate into more medals per capita or more medals per unit of wealth. It does the reverse.
Other things matter. In 2004 Imad Moosa and Lee Smith[2] from La Trobe University analysed the Sydney 2000 medal count and found it positively related to both expenditure on health as a proportion of GDP and the number of athletes representing each country (which is only loosely related to its population).
Read more:
How much are we prepared to pay for international sporting success?[3]
On an individual basis, the medal count may well be related to the amount of resources actually invested in winning medals (as opposed to the country’s total resources) and we often talk as if it is.
Here’s a headline about the Rio Olympics from Australia[4], one of the countries that invests the most in elite sport along with Korea, Japan, France and Canada[5]:
Is Australia’s disastrous Olympic campaign really $340 million well spent?
Another Australian newspaper report about Rio went as far as purporting to calculate the average cost to taxpayers per medal, which it said was A$20 million[6], “a price most of us seem prepared to pay”.
Read more:
Better than gold: the real value of the Olympic Games[7]
The medal count appears to matter for national pride, and arguably for broader participation in sport and wider health benefits (although an independent review for the Australian government failed[8] to find such a link) but the path to getting medals appears to depend on more than what we are able to spend to get them.
Which makes the results of the games surprising, as they should be.
Now for the Tokyo Games, hopefully to be held later this year!
Similar patterns emerged in the results of the 2016 Paralympics, the 2018 Commonwealth Games at the Gold Coast and the 2012 London Olympics.
If these results are driven by wealth rather than population (the two move together) they might flow from the things that tend to be associated with wealth, among them less exercise, more labour-saving devices and a less-healthy diet.
People in smaller and less-affluent countries might be more physically active and perhaps in better shape to become elite athletes.
Whatever the reasons, it seems clear that on an aggregate basis (not an individual basis) the ability to spend more money winning medals doesn’t translate into more medals per capita or more medals per unit of wealth. It does the reverse.
Other things matter. In 2004 Imad Moosa and Lee Smith[2] from La Trobe University analysed the Sydney 2000 medal count and found it positively related to both expenditure on health as a proportion of GDP and the number of athletes representing each country (which is only loosely related to its population).
Read more:
How much are we prepared to pay for international sporting success?[3]
On an individual basis, the medal count may well be related to the amount of resources actually invested in winning medals (as opposed to the country’s total resources) and we often talk as if it is.
Here’s a headline about the Rio Olympics from Australia[4], one of the countries that invests the most in elite sport along with Korea, Japan, France and Canada[5]:
Is Australia’s disastrous Olympic campaign really $340 million well spent?
Another Australian newspaper report about Rio went as far as purporting to calculate the average cost to taxpayers per medal, which it said was A$20 million[6], “a price most of us seem prepared to pay”.
Read more:
Better than gold: the real value of the Olympic Games[7]
The medal count appears to matter for national pride, and arguably for broader participation in sport and wider health benefits (although an independent review for the Australian government failed[8] to find such a link) but the path to getting medals appears to depend on more than what we are able to spend to get them.
Which makes the results of the games surprising, as they should be.
Now for the Tokyo Games, hopefully to be held later this year!
References
- ^ For now, the Tokyo Olympics will go ahead. But at what cost? (theconversation.com)
- ^ Imad Moosa and Lee Smith (onlinelibrary.wiley.com)
- ^ How much are we prepared to pay for international sporting success? (theconversation.com)
- ^ Australia (www.news.com.au)
- ^ Korea, Japan, France and Canada (www.idan.dk)
- ^ A$20 million (www.news.com.au)
- ^ Better than gold: the real value of the Olympic Games (theconversation.com)
- ^ failed (apo.org.au)
Authors: Malcolm Whyte, Emeritus Professor of Clinical Science, Australian National University